

When a small-cap stock jumps before the opening bell, it is tempting to focus only on how far the price has moved. A more useful first step is to ask why the stock is moving, how much trading activity supports the move, and what could make it reverse.
Warrior Trading has described five stock characteristics it looks for in momentum day trading: a strong move from the prior close, unusually high relative volume, a share price usually between $2 and $10 and below $20, a current catalyst, and a relatively small public float. In the sample chapter of How to Day Trade: The Plain Truth, Ross Cameron presents example thresholds of a gain above 10%, relative volume of at least 2, a preferred $2–$10 price range with a $20 ceiling, a same-day catalyst, and preferably 20 million float shares or fewer. These are screening preferences described in Warrior Trading educational material, not universal rules or promises. Read the Warrior Trading sample chapter.

The five characteristics are best used as a starting checklist. They do not determine whether a trade is safe, whether a company is fairly valued, or whether a stock will keep rising. A scanner cannot verify a headline’s meaning, guarantee a breakout, or prevent losses from a halt, wide spread, dilution or sudden reversal.
The five characteristics at a glance
| Characteristic | Warrior Trading sample reference | What a trader should check |
|---|---|---|
| Daily move | More than about 10% up from the prior close | Prior close, current price, premarket range and chart path |
| Relative volume | At least 2 times normal activity | Baseline and time-of-day adjustment used by the scanner |
| Share price | $2–$10 preferred; under $20 as the ceiling | Spread, liquidity, volatility and dollar risk |
| Catalyst | News or another identifiable event that day | Original company release or regulatory filing |
| Float | Preferably 20 million shares or fewer | Float estimate, filings, offerings, warrants and new share supply |
A separate Warrior Trading Gap and Go guide describes related but different preferences: $1.50–$10 preferred, a gap of roughly 20% preferred (5% as a lower threshold), float below 50 million, and a catalyst or former runner. Those details come from a separate strategy guide; they should not be blended with the five-characteristic list as though the numbers were identical. Read the Gap and Go guide.
1. A strong move from the previous close
The first characteristic is that the stock is already attracting attention. In the sample framework, the reference is a gain greater than 10% from the previous day’s closing price. If a stock closed at $8.00 and is now at $8.80, it is up 10%: ($8.80 − $8.00) ÷ $8.00 = 0.10. If the rule is strictly “more than 10%,” exactly 10% is the borderline rather than a pass.
This percentage is a way to find momentum, not evidence that a stock is cheap or must continue higher. A large gap may follow meaningful new information, but it can also be an overreaction, a thin premarket print or a move already stretched far from a reasonable risk point. Inspect the previous close, premarket high and low, current price and volume over time. A stock can be up 12% from yesterday’s close while falling sharply from its premarket high.
Chart context matters too. Look for whether price is holding above levels traders are watching and whether the move has a clear invalidation point. A percentage-change scanner alone does not tell you where a trade idea fails. If the stock has moved too far too quickly, passing on it may be the most disciplined decision.
2. Relative volume that is actually unusual
Relative volume, often shortened to RVOL, compares current trading volume with a normal baseline. A simple daily calculation is:
Relative volume = today’s share volume ÷ average daily share volume
If a stock has traded 4 million shares and its typical daily volume is 2 million, that simple ratio is 2. Cameron’s sample chapter explains the calculation with a 10-million-share day against a 1-million-share average, producing 10 times average volume. The five-characteristic list uses 2 as a reference point. Warrior Trading sample chapter.
Ask how a scanner defines the comparison. At 9:35 a.m., comparing five minutes of today’s trading with a full average day can produce a misleading figure. Some tools compare volume-to-date with typical volume-to-date at the same time of day; others divide current or projected daily volume by an average daily baseline. Those measures answer different questions. Read the platform’s definition before treating “RVOL 2” as meaningful.
Volume measures activity, not direction. Every completed trade has a buyer and a seller. High volume can show that many participants are engaged, but price action and order flow help show whether buyers are lifting offers, sellers are hitting bids, or the market is mixed. Heavy volume with stalled price can be a warning that momentum is fading.
3. Price under $20, with $2–$10 preferred
The price rule is easy to misstate. In the sample chapter, the preferred zone is $2–$10, with a ceiling below $20. Under that description, a $14 stock is inside the stated ceiling but outside the preferred band. A stock at $20 or above does not fit the sample screen.
Warrior Trading’s separate Gap and Go guide says $1.50–$10 is preferred and that stocks above $10 may still be considered when other criteria fit. The published guides describe different preferences. This article follows the sample chapter when explaining the five characteristics and keeps the other guide’s price range separate.
A low share price does not make a company small by itself. Market capitalization depends on price multiplied by shares outstanding. Nor does a low price make a trade safer: a 20-cent move on a $3 stock is a 6.7% change. A wide spread can consume a meaningful part of a possible move, and low liquidity can make exits difficult. Check the bid-ask spread, average volume, order-book depth, volatility and the amount you could lose. Treat the price band as a filter, not a quality score.
4. A catalyst you can verify
A catalyst is a new event that may explain why traders are paying attention now. Possible examples include earnings, a material company announcement, a regulatory decision, a contract or new clinical-trial information. A credible catalyst gives you a specific claim to investigate. It does not establish that the stock is worth more or that its price will continue in one direction.
Open the original company release or regulatory filing. Check when it was published, what it actually says and whether it includes conditions or caveats left out of a headline. Ask whether the event is new or whether an old story is being repeated. Be cautious with promotional posts, unsourced social-media claims and vague phrases such as “major news” when no primary source is available.
Warrior Trading support documentation says its “Ross’s 5 Pillar” scanners do not automatically filter for news; a trader must check the scanner’s news indicator. That is a useful reminder that a scanner result is a research prompt, not proof that a catalyst exists. Warrior Trading scanner documentation.
5. A relatively small float—and a check for new supply
Float is the number of a company’s shares available for public trading after excluding restricted holdings and certain insider or employee shares. A smaller float can make a stock more sensitive to changing demand because fewer shares are available to trade. That sensitivity can magnify moves in either direction. It may also come with wider spreads, less depth and greater difficulty getting an order filled at the price you expect.
The sample framework says Cameron preferred a float of 20 million shares or fewer. His separate Gap and Go guide says he likes under 10 million but may consider up to 50 million. Those are personal preferences from different Warrior Trading materials, not universal definitions of a low float. Float figures can be stale or estimated, so check recent filings when possible.
Look for possible new supply as well: public offerings, warrants, convertible securities, lockups expiring or other arrangements that could add shares. A low reported float does not mean no additional shares can reach the market. Short interest is also different from float; it does not replace a float check and should not be treated as a catalyst by itself.
Real-life chart example: GameStop, January 12–13, 2021
GameStop is a striking historical example of attention and unusual activity, but it is not a clean five-filter setup. It should not be used to imply that a trader could have predicted the move or that the framework makes a trade safe.
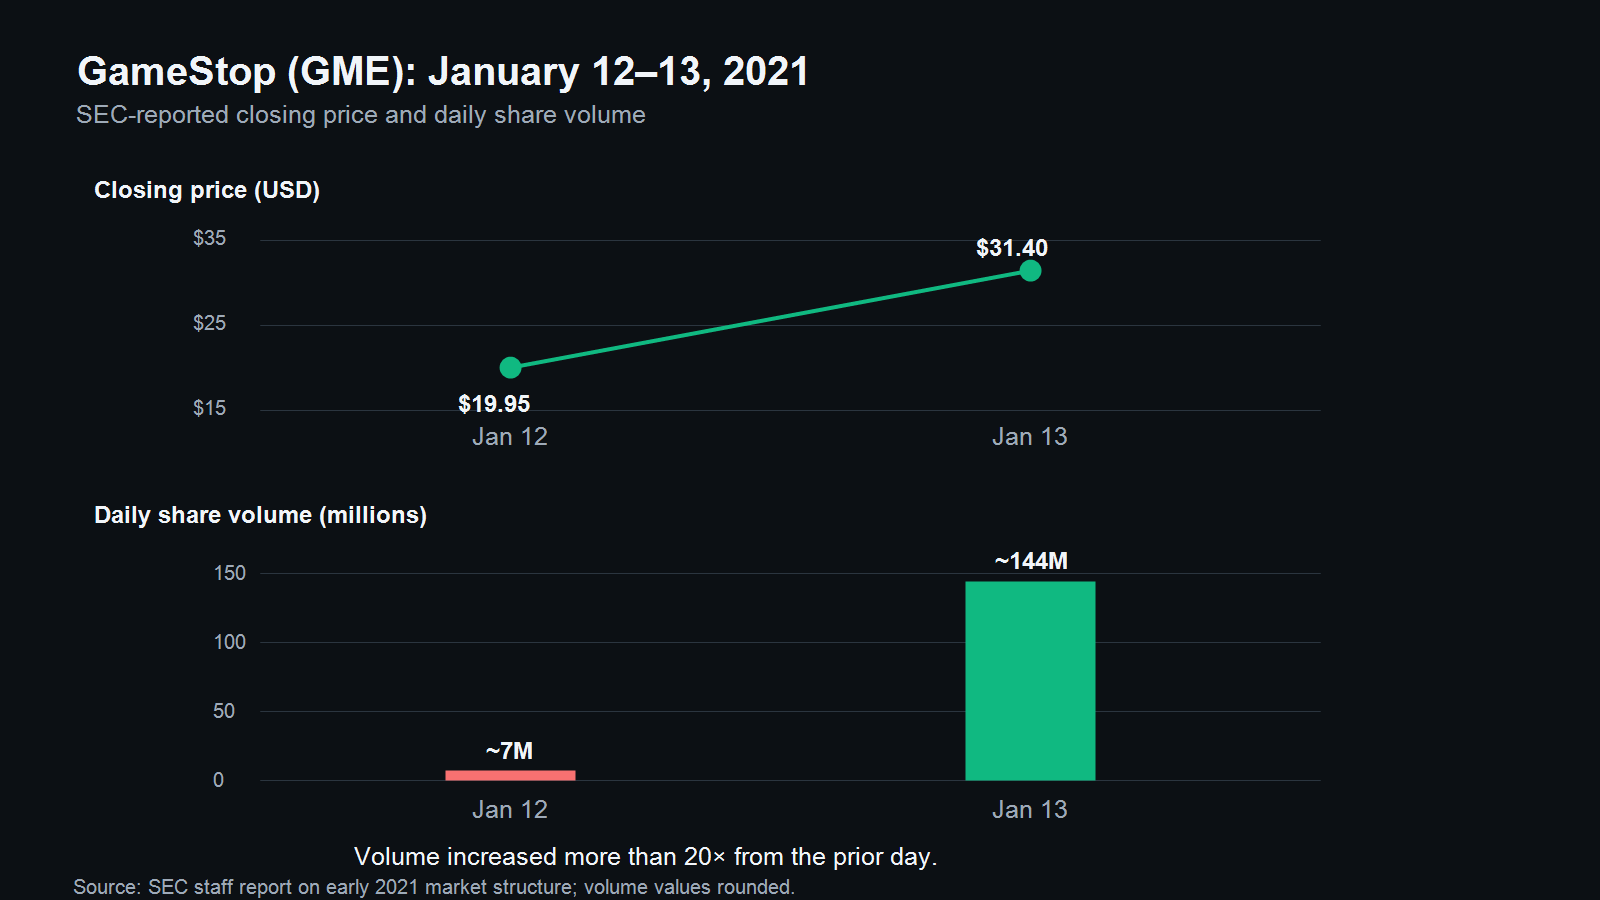
The SEC staff report says GameStop’s activity began increasing noticeably on January 13, 2021. Its closing price rose from $19.95 the day before to $31.40, and reported volume increased to about 144 million shares from about 7 million. That is more than a 20-fold volume increase from the prior day. The SEC describes the broader episode as a confluence of large price moves, large volume changes, high short interest, frequent Reddit mentions and major media coverage. SEC report release · SEC report PDF.
The chart shows only two dates, so it is an illustration of the reported close and volume change, not a full intraday chart or a trading signal. On January 13, GME’s close was already above the sample framework’s $20 ceiling. Its move also should not be described as a standard news-catalyst setup simply because short interest and online attention were high. Social attention, a short squeeze narrative and a company news catalyst are different things.
Warrior Trading’s sample chapter also uses GameStop to discuss supply and demand, comparing its share supply with that of a much larger company and noting days when volume exceeded the cited float. That example helps explain why available supply and demand can interact. It does not show that a low float alone causes a rally or that a similar stock will repeat the move.
A practical watchlist example
Imagine a fictional company, ABCD, trading at $6.40 after a previous close of $5.70. The move is about 12.3%: ($6.40 − $5.70) ÷ $5.70. Suppose it has traded 3 million shares against a typical full-day volume of 1.2 million, making the simple ratio 2.5. The company published a new contract announcement before the open, and a recent filing suggests 14 million public float shares.
On paper, that fictional example sits inside the preferred price band, exceeds the sample daily-move and relative-volume references, has a catalyst to verify and appears below the preferred 20-million float reference. It is a candidate for more research, not an automatic trade. The trader still needs to read the release, inspect the chart and spread, check for offerings or warrant terms, and decide the maximum acceptable dollar loss. If the price is extended, the spread is wide, the news is old or volume fades, the name may be rejected even though it passed the screen.
The GameStop event and the fictional ABCD walk-through serve different purposes: one shows a real, unusual market episode; the other demonstrates how the checklist might be applied. Neither identifies a stock to buy or sell.
What the five filters leave out
The five characteristics do not define an entry, an exit, position size or the level that invalidates a trade idea. They do not account for halts, volatility pauses, order-routing differences, borrow fees, slippage or a company selling more shares. A stock can meet every screen and still fall sharply. Fast moves can carry prices through intended stop levels, and a stop order may fill at a worse price than expected.
Before taking any setup, define the price level that would show the idea is wrong and decide the maximum dollar loss in advance. Consider whether the stock is liquid enough for a realistic exit. Avoid risking money you cannot afford to lose. A journal can help you evaluate whether a setup fits your process over a meaningful sample of trades, but historical results do not guarantee future performance.
A five-question premarket checklist
- Is the stock up more than about 10% from the previous close, and what does its full price path look like?
- Is relative volume unusually high for this time of day, and how does the scanner calculate it?
- Is the price below $20, with $2–$10 as the preferred band in the sample framework?
- Can I verify a new catalyst from the company or a regulatory source?
- Is the float relatively small, and have I checked for offerings, warrants or other potential share supply?
If an answer is unclear, pause and research it. A watchlist can be short. Passing on a stock that does not fit your rules is part of a repeatable process.
Frequently asked questions
What are Warrior Trading’s five stock selection characteristics?
The sample framework describes a stock up more than about 10% from the prior close, relative volume of at least 2, a price preferably between $2 and $10 and below $20, a same-day catalyst, and preferably 20 million shares or fewer in float.
Does the price have to be under $10?
No. In the five-characteristic sample, $2–$10 is preferred and $20 is the ceiling. A separate Warrior Trading Gap and Go guide prefers $1.50–$10 but says higher-priced stocks may still be considered when other criteria fit.
Do the five filters mean a stock is likely to go up?
No. They are screening characteristics used to narrow a watchlist. They do not predict the next move or remove the risks of volatility, poor liquidity, halts, dilution or losses.
Sources and attribution
- Warrior Trading, How to Day Trade: The Plain Truth, sample chapter
- Warrior Trading, Gap and Go strategy guide
- Warrior Trading Support, scanner documentation
- U.S. Securities and Exchange Commission, early 2021 market structure report release
- SEC staff report PDF
Warrior Trading and Ross Cameron are referenced for attribution and commentary on their publicly available educational material. Greenwick is independent and is not affiliated with, sponsored by or endorsed by Warrior Trading. This article is for education only. It is not investment advice and does not recommend buying or selling any security. Day trading is risky, and losses are possible.